A buyer calls on Sunday night, quotes a price per bag and wants an answer before his lorry pulls out on Monday. You have a phone and a few minutes. The Kenyan market prices you can reach from that phone are not one list. They are at least four separate tables, built by four separate bodies for four separate jobs, and they disagree for reasons that have nothing to do with the maize in your store. A grower who reads them as one number will either turn down a fair offer or accept a bad one. This piece sets out what each table measures, the unit it is printed in, how fresh it is, and how far it sits from the price a trader will pay at your gate.
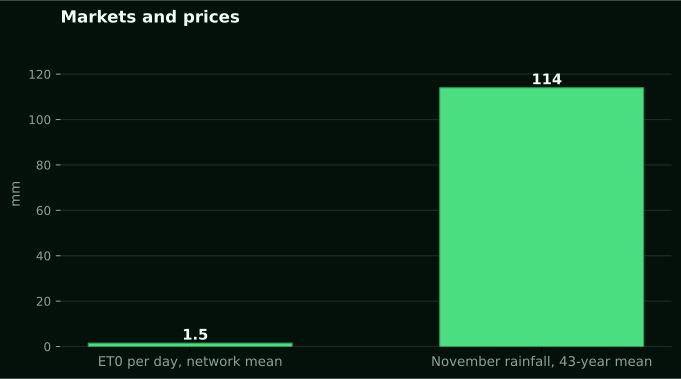
Measured by NuaSense weather stations and soil probes on Kenyan farms, over the period stated with each figure. Past readings, not a forecast.

Four tables, four units
Begin with the unit, because that is where most comparisons fall apart before you read a shilling. KAMIS, run by the Ministry of Agriculture and Livestock Development, prints wholesale and retail in shillings per kilogram, with a market name, a county and a date on every line. The Warehouse Receipt System Council prints a weekly table in bag units: 90 kg for grains and pulses, 50 kg for potatoes. Strathmore's SAFIC AgriIntel page prints a per-kilogram median across many markets, with the number of markets and counties beside it. The World Bank's Real Time Prices series covers a great many markets but fills gaps with estimates and publishes a modelled range rather than one observed quote. IFPRI's monthly Food Price Monitor for Kenya tracks commodity price trends in selected markets, which makes it a trend view rather than a quote to sell against. Side by side:
- KAMIS (Ministry of Agriculture and Livestock Development): wholesale and retail per kg, one market per line, dated; blank cells are routine; costs nothing to read.
- WRSC weekly table (Warehouse Receipt System Council): average wholesale per 90 kg bag for grains and beans, per 50 kg for potatoes, averaged across local markets for the week ended; variety named; free.
- SAFIC AgriIntel (Strathmore): per kg median across markets, each commodity carrying its own month and market count, sourced to KAMIS or FEWS NET; free.
- World Bank Real Time Prices: 233 markets, 2007 to 2026, weekly updates, missing cells estimated by machine learning, published as Open, High, Low and Close; free but modelled.
- IFPRI Food Security Portal: a monthly Food Price Monitor for Kenya on trends in selected markets; a trend view, not a quote to sell against.
None of these prints a farm gate price. Every one is a wholesale, retail or market figure, and the gap between any of them and your gate is the subject of the second half of this piece. Nobody needs to pay for a price table in Kenya. All five are free, so the only question is which one to open first, and that depends on what you are selling and where the lorry is going.
KAMIS: one market, one day, two grades on the same line
Open KAMIS when you know which market your buyer is heading for. The Ministry's KAMIS market price page lists commodity, class, grade, market, county, date, wholesale and retail per kilogram, and sometimes a supply volume, on each row. Read one row properly and you learn more than from a national average. Take Gikomba in Nairobi on 23 October 2023. Yellow maize was quoted at 94.44 per kg wholesale and 115.00 retail. White maize in the same market on the same day was 66.67 wholesale and 75.00 retail. Same market, same date, same crop by name, and a wholesale gap of 27.77 per kg between the two grades (94.44 minus 66.67). That is a grade decision, not a forecast: it tells a grower with both colours in store which bags to load first for a Nairobi buyer that week.
White maize wholesale quotes for that date ran from 40.00 per kg at Kibiok in Nandi up to 66.67 at Gikomba, with Eldoret Main at 50.00 and Kangemi Market at 52.22. Two details in those rows deserve a second look. Kibiok's line is dated 22 October, a day earlier than the rest, so the table is not strictly same-day across markets. And Kangemi carries a wholesale figure with no retail figure at all. A blank cell is data. It means the retail step in that market was not recorded that day, not that nobody sold a kilo of maize at retail in Kangemi. Treat the blank as a missing measurement and look at the neighbouring market rather than filling it yourself.
Retail minus wholesale
KAMIS prints wholesale and retail side by side, so you can see the step between them. That step differs wildly from one market to the next in the same week. At Kibiok the white maize line reads 40.00 wholesale and 44.44 retail. Subtract and the step is 4.44 per kg. At Kagio in Kirinyaga the mixed-traditional maize line reads 50.00 wholesale and 70.00 retail, a step of 20.00 per kg. Same commodity family, same week, and the retail margin in one market is more than four times the margin in the other (20.00 divided by 4.44 comes to a little over 4.5).
So what does a grower do with that? When a buyer quotes the retail price in his destination town to justify the number he offers at your gate, you now know that retail can sit very close to wholesale or very far above it. The wholesale line is the one his lorry is actually sold into. Argue from the wholesale column. An agrovet or a group selling direct at a town market can look at the Kagio line, see where traders capture a wide margin, and decide whether a stall beats selling into wholesale.
One caution: these are single-day quotes for single markets. Mixed-traditional maize that same week ran 31.73 at Rongo in Migori, 50.00 at Kagio, 50.00 at Kabati in Kitui and 55.56 at Othaya in Nyeri. A range that wide across four counties is normal in the table. It is a reason to read the row for the market your crop will actually reach rather than the national headline. Who keeps which slice of that spread is what the piece on farm gate, open-air market and aggregator worked out; this piece stays on the tables themselves.
Supply volume tells you how thin the trade is
At 31.73 per kg, Rongo is the lowest in that set. A grower in Migori could look at that and think maize is almost worthless in the county. The same table tells a different story, because KAMIS puts a supply volume on some rows. Rongo's row shows 3200.00 next to its 31.73 wholesale price. Ikonge in Nyamira shows 32000.00 next to 43.33 per kg. That makes Ikonge's volume ten times Rongo's (32000 divided by 3200), and its price 11.60 per kg higher (43.33 minus 31.73). KAMIS gives no reason, and this piece won't either. But a very low price beside a small volume tells you about thin local trade that day, not what a bulk seller with a full lorry would get.
For Monday's decision, this cuts both ways. Say your buyer quotes the Rongo number as the going rate. The volume column lets you answer that it came from a market handling a tenth of what Ikonge handled, and that a bulk sale is a different trade. But if you hold a small quantity and have no lorry, the thin-market price is closer to your reality. The Ikonge figure is not available to you without transport. Read the supply column as telling you which rows describe trade at your scale.
The limits are real. Volume shows up only on some rows. The unit is not stated on the line, and the table does not say whether it covers a day or a week. Treat it as a relative weight between markets, large against small, never as a tonnage. Where a row has a price and no volume, you have a quote with no sense of how much trade sits behind it. That is the same spot the blank retail cell at Kangemi leaves you in on the other side of the line.
Bags, averages and a named variety on the WRSC table
The Warehouse Receipt System Council regulates certified warehouses. Its market information page carries a weekly table that reads differently from KAMIS in three ways: bags instead of kilograms, an average across local markets for the week ended instead of one market, and a named variety. The WRSC structured markets page put white maize at 3,511.65 per 90 kg bag and red Irish potato at 3,171.33 per 50 kg bag in the same week. Two bag sizes sit on one table. A reader who compares those two numbers as if they shared a unit has already made an error.
For a bean grower, variety is the most useful thing on the page. One week listed three bean types separately, all per 90 kg: Canadian Wonder at 10,809.30, Red Haricot (Wairimu) at 9,930.13 and Rosecoco Nyayo at 11,410.17. Cheapest to dearest, that is 1,480.04 per bag (11,410.17 minus 9,930.13). Green grams split the same way: hybrid polished at 10,675.46 and local special at 11,200.68 per 90 kg. A buyer who says "beans" and names one price is averaging across varieties the market itself does not average. The seed bought at the agrovet counter the previous season already decided which of those lines you are on.
Don't divide the bag figure by 90 and put it beside a KAMIS per-kilogram quote. WRSC gives a weekly average over several unnamed local markets; KAMIS gives one market on one day. A per-kilo conversion would hide that difference, not remove it. Use WRSC for the week's level and the variety premium, and KAMIS for the specific market. The council also defines a warehouse receipt: a negotiable document from a certified warehouse confirming ownership, quantity and quality of stored goods. It can be sold or transferred instead of the grain being dumped at harvest. That is the first named alternative to selling on Monday at all.
Read the market count before the shilling
Strathmore's SAFIC AgriIntel page gives one per-kilogram median for each commodity. Beside it, the page prints the number of markets, the number of counties and the month. That coverage count is the honest measure of how much to trust the median, and it varies enormously down the page. The SAFIC market prices page reports maize at KES 58.60 per kg as the median of 90 markets in 44 counties for August 2026, sourced to FEWS NET. Beans sit at KES 146.40 per kg, 78 markets in 40 counties, same month and source. Those are broad bases. Rice, on the same page, is KES 175.00 per kg from a median of only 13 markets in 9 counties for October 2026, sourced to KAMIS. A rice grower in a county outside those nine is reading a number that may describe nothing near them.
Months differ too. Maize and beans carry August; rice, kale, spinach and milk carry October; goats carry September. Kale is KES 51.15 per kg from 32 markets in 12 counties, and spinach is KES 60.00 from 23 markets in 11 counties. Milk is KES 82.90 per litre from 10 markets in 6 counties. Goats are KES 6,400.00 per head from 22 markets in 22 counties. They are priced per animal because that is how livestock trades. Cowpeas are KES 145.00 per kg over 22 markets in 9 counties, and pigeon peas are KES 140.00 over 11 markets in 8 counties, both October. Two figures on one screen can refer to different months and different numbers of markets. So the page is a set of separately dated snapshots, not a single day's board.
Use it for a fast national read on a staple. For a thin crop, treat it with suspicion. One strange quote will not shift a median of 90 markets; it can shift a median of 13. Check the count first, then the month, then the shilling.
Why a World Bank cell may be a model, not a measurement
This has the widest coverage, and it needs the most care. The World Bank's Real Time Prices dataset for Kenya covers 233 markets from January 2007 to November 2026 in the version released on 2 November 2026. The Bank's Development Economics Data Group compiles and updates it weekly. Prices underneath come from the World Food Programme, the UN Food and Agriculture Organization and selected national statistical offices. That sounds like the richest free source in the country, and in one sense it is. Method is the catch. Machine learning predicts missing entries from exchange rates and from prices at other markets or related items. So a filled cell is not necessarily a measured one. Outliers get statistical adjustment, intra-month ranges are modelled, and the series publishes Open, High, Low and Close estimates rather than one observed price.
The dataset's own documentation warns these estimates may differ from other official sources. That includes the Bank's International Comparison Program and the inflation series in the World Development Indicators. The exchange-rate component also includes an unofficial parallel-market estimate credited to FAO GIEWS and International Forex. None of this makes the series useless. It makes it a research product. For Kenya, it names sub-national areas including Coast, North Eastern, Rift Valley, Eastern, Nairobi, Embu, Hola in Tana River, Central, Nyanza, Kwale, Lamu, Meru, Kajiado, Taita Taveta, Tharaka Nithi and a market average. Beans, goats and maize are among the named food items. That mix of regions and single towns was built for analysts, not for a seller on Monday morning.
My position: use it to see how a region's price moved over years. Never quote its High or Low to a buyer as if someone stood in a market and wrote it down. For a sale, a measured KAMIS row beats a modelled World Bank cell every time.
Your gate against the wholesale row
None of the tables above prints a farm gate price for a crop. The gap between the wholesale column and your gate decides whether Monday's offer is fair. FAO's MAFAP work gives the cleanest frame for that gap. The MAFAP analysis of price incentives for cattle producers in Kenya compared yearly averages of domestic farm gate and wholesale prices against a reference price built from the international market. It expressed the gap as a Nominal Rate of Protection, a percentage of that reference. Positive gaps read as incentives; negative gaps as disincentives. For cattle over 2005 to 2010, it found producers generally received lower prices than more efficient markets would have paid them. MAFAP ran the same farm gate and wholesale comparison for Kenyan wheat and maize over 2005 to 2013 in separate technical notes.
Take the framing, not the old cattle figures. You can place your own gate price on three rungs. Compare it with the KAMIS wholesale row for the market your buyer sells into. Compare it with the WRSC weekly average. For a commodity that trades across the border, compare it with whatever international reference you can reach. A gate price sitting far below the wholesale row week after week is the disincentive MAFAP described. That is on a crop where the volume column shows thick trade. It is the signal to change where or how you sell, not to argue harder with the same buyer.
The sources do not give a transport cost, a broker commission or a percentage split between gate and wholesale. I will not invent them. Those depend on your road and your lorry. Write down your last three sales, the price received, and the KAMIS wholesale figure for the destination market on that date. Read the gap off your own sheet. Three real sales beat any published ratio.
Sometimes Monday is the wrong day to sell
The public sources name alternatives to the spot sale. WRSC lists KAMIS alongside the Kenya Multi Commodity Exchange and the Makueni county online marketing portal Soko Makueni. It describes the warehouse receipt as the instrument that lets stored grain be sold or transferred later. Whether holding grain pays depends on storage loss. Public policy has tried to tackle that with money rather than advice. The World Bank's review of pull mechanisms for overcoming market failures describes the AgResults Kenya On-Farm Storage Pilot. It was launched at the June 2012 G20 Summit in Los Cabos as one of seven pilots. It paid private-sector incentives only after predefined results were achieved. Nobody was paid to promise storage; payment followed demonstrated storage.
Put that on a block in your county. When a certified warehouse is within reach, the receipt turns a Monday decision into a week-long choice, and you watch the WRSC weekly average instead of one day's KAMIS row. With no certified warehouse you can reach, you choose between your own store and the spot market. Your store's cost is a loss you only measure when you open the bags. Market information in Kenya has historically carried more than prices. Kizito's 2019 review of agricultural market information systems on Gates Open Research reports that these systems produced customised information including wholesale and retail prices, new market entrants and new product varieties. That is the kind of content a county portal such as Soko Makueni exists to carry.
If the tables leave you with a thin local market, a small quantity and no lorry, the cheaper option is usually the honest one. Sell locally. Don't pay transport chasing a Nairobi number, and note the gap for next season.
The phone routine
Open the tables in this order. Each step is an action, every step is free, and nothing here requires buying anything from anyone.
- Ask the buyer which market the lorry is going to. Open KAMIS and find that market's row for your commodity, grade and the nearest date. Note the wholesale column, not the retail one.
- Check the date on the row. If it is a day behind the others, as Kibiok was, say so when you quote it back.
- Look for the supply volume on that row and on a neighbouring market's row. A low price beside a small volume is thin trade, not the bulk rate.
- Open the WRSC weekly table for the week's average level and for the variety premium if you are selling beans or green grams. Keep it in bags; do not divide.
- Open SAFIC only for a national level, and read the market count and month before the shilling. Thirteen markets is a thin base.
- Write the buyer's gate offer beside the KAMIS wholesale row. That difference is your gap for this sale. Add it to the sheet of your last three sales.
- If the gap is wide and a certified warehouse is reachable, ask what a receipt would cost you before you say yes.
For inputs, the piece on whether cheaper fertiliser in the next county is worth the trip runs the transport arithmetic that this routine leaves to your own sheet. For outputs, KAMIS county market prices also sit free on the NuaSense dashboard beside a farm's own IoT farm sensor readings, and openly at agriculture-data.com. You do not need a station to read them. Grain growers who want the growing side can turn to the NuaSense guide to growing wheat in Kenya. It covers KALRO varieties, agro-ecological zones, harvest and selling the grain, and stops where this piece starts. One honest limit: none of the sources checked here prints a farm gate price. None describes an SMS price service, its charge or its reliability, so I will not rate one. Build the gate figure from your own sales. Nobody else is measuring it.