Short rains input planning gets talked about as a checklist: buy seed, buy fertiliser, wait for rain, plant. That framing hides the actual mechanism. What matters is what water does to soil, seed and fertiliser once it starts falling, in what order, and how fast. Get the sequence wrong and the inputs you bought on time behave as if you bought them late.
Measured by NuaSense weather stations and soil probes on Kenyan farms, over the period stated with each figure. Past readings, not a forecast.
The soil has to wet up before anything else counts
Before a seed can imbibe water or a granule of fertiliser can dissolve into a form roots can use, the soil profile itself has to take on moisture. Across our own probe network, soil moisture over the past reporting month averaged 60 percent of sensor scale, with most readings falling between 18 and 92 percent (10th to 90th percentile). That range on its own tells you something planners forget: two blocks a short walk apart can sit at opposite ends of that spread depending on soil texture, slope and whatever rain fell in the last week. A single seasonal average is not a planting instruction for any one field.
The texture and water-holding capacity baselines behind a lot of planning tools, drawn from iSDA Africa and SoilGrids, are modelled map values from around 2016. They are a starting point for guessing how fast a given soil will wet up, not a soil test of your particular plot. If you have never had the plot tested, treat those baselines as a rough prior to be checked against what you actually see after the first rains land.
Germination needs standing moisture, not a wet-looking field
A field that looks damp on the surface after a short shower is not the same as a profile that has taken up enough water for germination. Six Important Things to Consider as You Prepare for the Planting Season, from PlantVillage makes the point plainly: soil should be tested for pH and nutrient content before planting, and seed should be sourced from recognised suppliers for germination rate, precisely because germination is conditional on both soil chemistry and moisture, not on rainfall having simply occurred.
This is where a probe earns its keep over a rain gauge alone. The gauge tells you rain fell. A shallow soil probe tells you whether that rain actually raised moisture at the depth where the seed sits, which is the number that predicts germination, not the millimetre total on the roof of the store.
Infiltration has a ceiling, and the first storm tests it
Dry soil at the start of a season does not accept water at whatever rate it falls. A rainfall simulation study documented in PMC applied rain at 3.17 cm per hour for 40 minutes onto soil boxes pre-wetted to between 50 and 100 percent of field capacity, specifically to study what happens when intensity outpaces the soil's ability to take water in. The finding that matters for short rains planning is not the rate itself, since Kenyan storm intensities were not measured in that trial, but the mechanism it isolates: wetter soils produced higher concentrations and greater mass loadings of surface-applied nitrogen in the runoff. The wetter the starting profile, the more anything sitting on the surface moves sideways instead of down.
On a Kenyan block that means the first storm after a dry spell, the one growers are often most eager to catch with an early top-dress, is also the one most likely to strip a surface application straight into the drain line if the soil is already near capacity. The lesson transfers even though the trial did not happen here: check what the soil is doing before the storm, not just whether the sky is doing something.
Nitrogen sitting on the surface does not wait for you
The same PMC rainfall simulation used urea surface-applied at 150 kg N per hectare and found it lost in runoff under simulated rainfall onto pre-wetted soil. That is a laboratory box, not a Kenyan field, and the loss fraction reported there should not be quoted as a Kenyan number. But the physical relationship holds anywhere: urea broadcast on the surface ahead of a storm is vulnerable exactly during the window between application and incorporation, and wetter antecedent soil moisture makes that window worse, not better.
This is the argument against the instinct to fertilise the moment the first rain is forecast. If the ground is already carrying moisture from a preceding shower, a surface urea application timed to that rain is closer to a runoff event than a fertiliser event. Why the date on your calendar is the wrong reason to top-dress works through this in more depth: the trigger for top-dressing should be a soil moisture and temperature reading, not a date circled before the season started.
The six routes water can take, and which one you are paying for
The FAO framework on agricultural investment for improved rainfall capture sets out six routes rainwater can follow once it lands: surface runoff, evaporation, weed transpiration, crop transpiration, soil storage, and deep drainage. Only one of those, crop transpiration, is the one a grower is trying to buy with a fertiliser or seed budget. Every input decision made before the rain arrives is really a decision about which of the other five routes you are willing to lose water to.
That same FAO document is blunt about the scale of the opportunity: in Mali, farmer disposable income could more than double if the share of rainfall captured for productive use rose from 40 to 60 percent, with further gains at 80 percent. That is a Mali figure from a specific analysis and it should not be quoted as a Kenyan number, but the structural point transfers cleanly: weed control ahead of the rains, timing of tillage, and mulching or basin structures all shift water away from evaporation and weed transpiration and toward the crop, before a single input has been applied.
How far the historical rainfall record carries
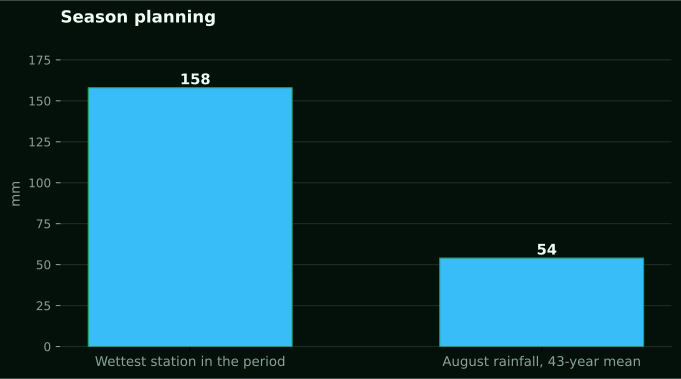
Long-term CHIRPS rainfall data at the grid cells where our own weather stations stand averaged 54 mm across August over 43 years of record (1983 to 2025), ranging from a driest August of 26 mm in 1986 to a wettest of 83 mm in 2025. That is a satellite-and-gauge product, not a rain gauge at your farm, and it describes what has happened at those specific locations, not a forecast of what will happen this season.
The spread itself, roughly threefold between the driest and wettest year on record, is the useful number. It says that any single seasonal average, however official, sits on top of enormous year-to-year variation, and an input plan built around the average alone is built around a number no actual season is likely to match exactly.
One month of readings from our own network
Rainfall recorded at individual NuaSense weather stations over the three weeks to 23 August 2026 ranged from 0.0 mm to 157.6 mm across eight stations, a spread that on its own should discourage anyone from treating a single figure as regional. Only 98 of 3,072 ten-minute readings across the network, 3.2 percent, recorded any rain at all in that window. That is a description of what instruments recorded in the past, not a signal about the coming short rains: NuaSense does not forecast weather, and this data should not be read as an outlook.
Average air temperature across eleven stations over the same period ran from 3.9 to 31.3°C with a mean of 17.0°C, and mean relative humidity sat at 75 percent, ranging from 22 to 100. Those ranges matter for seed store conditions and for judging how fast surface soil will dry between showers, but again, they describe a recorded past period across multiple private farms, not any single named location.
Evapotranspiration keeps drawing water out while you decide
Reference evapotranspiration computed from our station readings, using the FAO-56 method applied hourly, averaged 1.6 mm per day across four stations over the four weeks to 20 August 2026. That is reference ET0, describing evaporative demand from a standard grass reference surface, not the water use of any particular crop at any particular stage. The point for input planning is simpler than a crop coefficient calculation: whatever rain falls into the soil profile is being drawn back out continuously, day and night, at a rate that does not pause while a farm manager weighs up seed varieties.
Vapour pressure deficit over the same period averaged 0.57 kPa but peaked at 2.96 kPa, a more than fivefold swing that tracks directly onto how fast a wetted seedbed can dry back out between rain events. A field that looks planted-ready the morning after a storm can lose that window within days if VPD spikes, which is a reason to have moisture data at planting depth rather than relying on memory of the last rain.
Leaf wetness decides when crop protection can even go on
Leaf wetness was recorded in 40 percent of station-hours across four stations over the same period, roughly 9.6 hours in an average day. Spray window quality, an index computed hourly from 0 to 100 on each station's own readings, scored 60 or better in only 15 percent of the 2,465 station-hours examined, and below 30 in 59 percent of them. That means, on the evidence of this network's own record, good spray conditions were the exception rather than the rule across the period measured.
For a grower stocking fungicide or a foliar product ahead of the short rains, that skew matters more than the seed and fertiliser order. A pesticide or herbicide bought on schedule, as PlantVillage's planting-season checklist recommends doing well in advance, still needs a window with acceptable leaf wetness and humidity to be applied effectively. Buying early solves availability. It does not solve timing.
Soil temperature moves at two speeds under one field
Soil temperature across our probes averaged 16.4°C over the past month, but the two depths behaved differently: the steadier depth moved through a range of 1.7°C while the more variable, shallower behaviour moved through 2.7°C, a factor of roughly 1.6 between them. Germination and early root development respond to the temperature at the depth where the seed and young root actually sit, not to whatever the surface is doing on a given morning. A single air temperature reading, or even a single soil reading from the wrong depth, can misrepresent what a germinating seed is actually experiencing by a meaningful margin.
This is one reason a generic planting-date rule breaks down at field level: the shallow zone warms and cools faster than the deeper zone, and which one governs germination depends on where the seed is placed and how deep. There is no single Kenyan number for this relationship in the material available, so the honest answer is to measure both depths on your own block rather than assume one tracks the other.
Forecasts change the arithmetic, not the weather
An analysis of irrigation decisions published in Irrigation Science found that using forecasted rain intensities three days ahead produced a water saving of 0 to 100 mm and a drainage reduction of 0 to 60 mm compared with reactive scheduling, and that seven-day probabilistic rainfall forecasts lifted modelled crop profit by 16 percent over relying on real-time soil moisture alone. Combining historical ensemble forecasts with optimisation produced gains of 2.4 to 8.5 percent in profit and 11.0 to 26.9 percent in water saved.
Those figures come from modelled irrigation scheduling studies, not from Kenyan short rains, and they should not be repeated as a Kenyan input-saving claim. What they demonstrate is a mechanism worth taking seriously: a forecast, even an imperfect one, changes the arithmetic of a decision made several days in advance, because irrigation and input timing decisions have to be locked in before the event they respond to. The Kenya Meteorological Department's seasonal forecast product exists for exactly that reason, and the October to December 2025 outlook it published covers the northeast, southeastern lowlands and coastal region specifically. It is worth reading before locking a purchase order, understanding that a seasonal outlook is not the same instrument as the three-day and seven-day forecasts used in that irrigation study.
Where extension thins out, this sequence is self-taught
Extension coverage across parts of sub-Saharan Africa runs as thin as one agent per 1,000 farmers, according to the IITA analysis of climate risk to smallholder farmers. At that ratio, a farm manager waiting for an extension visit to confirm whether the profile has wetted up enough to plant, or whether a top-dress will run off, is waiting for a resource that structurally cannot reach most blocks in time. The same IITA piece notes that 95 percent of African farmers depend on rain-fed agriculture, which is precisely the population for whom the sequence in this article, wetting, infiltration, nutrient timing, drying, matters most and gets the least outside verification.
Digital tools do not replace an agronomist but they can fill some of that gap by putting the physical numbers, moisture at planting depth, soil temperature at two depths, rainfall actually recorded rather than assumed, in front of a manager directly. How to increase crop yields in Kenya works through the soil and water constraints behind low national yield averages in more detail, and our sensor and alert system is built around exactly this sequence: field data gathered, turned into the moisture, temperature and spray-window figures used through this piece, delivered as a decision rather than a raw reading.
Where the sequence actually breaks: three failure modes worth naming
The first failure mode is applying fertiliser to the calendar instead of the soil. A top-dress timed to a circled date rather than a measured moisture and temperature reading will sometimes land on already-saturated ground, and the PMC rainfall simulation is clear about what happens to surface urea under those conditions: it moves, it does not stay.
The second is treating a seasonal outlook as a planting trigger rather than a planning input. The Kenya Meteorological Department's seasonal forecast tells a manager which regions face which broad conditions; it does not tell a manager whether a specific field's profile has taken up enough moisture at seed depth to germinate. Those are two different questions and conflating them is the single most common way a correctly bought input still fails at the right time.
The third is assuming a single soil reading, or a single rainfall total, describes the whole farm. The spread across our own network, station rainfall totals from 0.0 to 157.6 mm and soil moisture spanning 18 to 92 percent of sensor scale in the same reporting window, is the clearest evidence available that variability inside a normal farm boundary can rival the variability between entire regions. Planning short rains inputs off one number, whether it is a seasonal average, a single gauge reading or a memory of last year, is planning off a number that almost certainly does not describe the field being planted.
Fertiliser price gaps across counties are worth reading alongside this piece too, since the cost side of input planning carries its own variability that compounds whatever the soil and rain are doing.
Also drawn on for this piece: Research on short-term precipitation forecasting method.